OrientXplot is a Windows program to manipulate and display relative orientation data of pairs of single crystals
in a stereogram, allowing for the symmetry of both crystals. It reads orientation matrices from all commercial single-crystal diffractometer systems, and
orientations of crystals described as Euler angles (e.g. from EBSD measurements). It is especially useful to analyse the orientations of single
crystal inclusions trapped within host crystals.
The program is described in an article published by Angel, Milani, Alvaro & Nestola 'OrientXplot: a program to analyse and display
relative crystal orientations'.
Journal of Applied
Crystallography, 2015, 48, 1330-1334. A reprint is available as a pdf
file, Copyright © International Union of Crystallography.
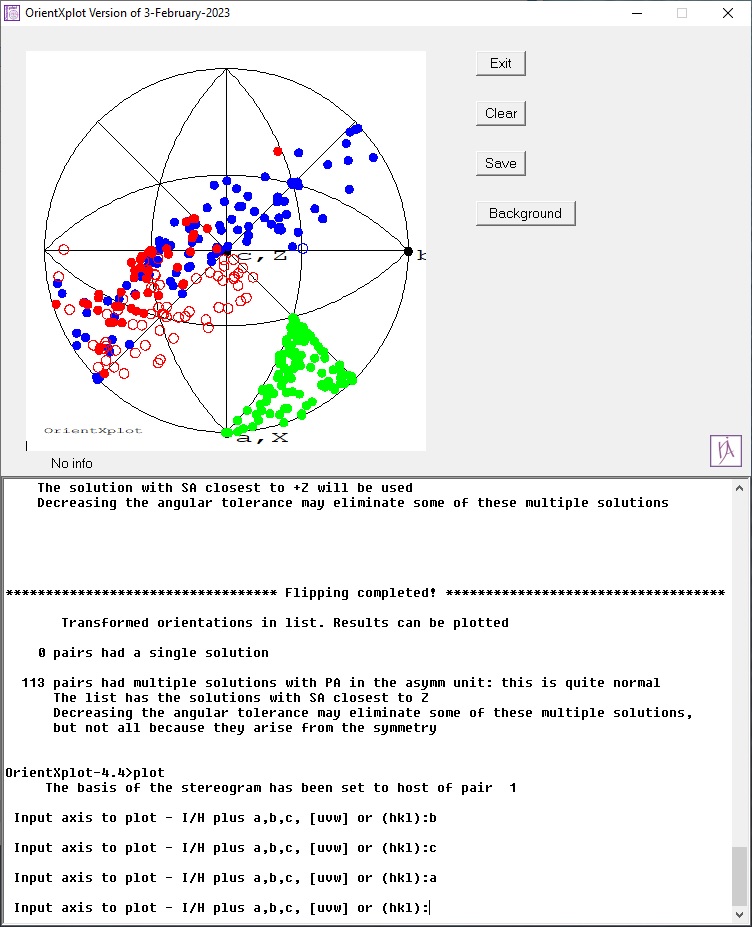
The screenshot of the program below shows 113 published orientations of olivine inclusions in diamonds from around the world,
plotted as the orientations of their a-axes (red), b-axes (green) and c-axes (blue) relative to their host diamonds. The dataset
includes orientations determined by EBSD and Xray diffraction. The spread of the poles of the a-, b- and c-axes
clearly shows that these olivines show no prefered orientation with respect to their host diamonds. For details of the analysis, see the papers by
Nestola et al. (2014) and
Milani et al. (2016)
 |
OrientXplot reads information about the orientation of sets of single crystals as either orientation matrices
or as Euler angles. It therefore handles data from all commercial single-crystal diffractometers and from a variety of EBSD programs. The
program can plot the orientations of the individual crystals with respect to the instrument or, more importantly, calculate and display the
relative orientations of two crystals, for example inclusions in hosts, twinned crystals and crystals on substrates.
For a comparison between the orientations of guest crystals in different hosts, it is necessary to take into account the ambiguity
in indexing the diffraction patterns that arises from the symmetry of both the guest and the host crystals. Failure to allow for this
ambiguity can lead to errors in interpretation of orientation data, or failure to recognise systematics in the relative orientations of two phases.
In principle, the symmetry could be allowed for in the diffractometer software by re-indexing of the diffraction patterns in each of the
symmetrically-equivalent orientations, but such an approach would be time-consuming and tedious. Instead, the ‘re-indexing’ can be performed by
OrientXplot under user control and it can then display the resulting orientation data in stereograms as shown above.
Last Update: Version 4.4 (February 2023). The new release includes several bug fixes for lower symmetry systems, and big improvements to handling data
files containing several types of data. If you are using an older version, please update to this version.
- Before installing, uninstall previous versions of OrientXplot, by using the Uninstall utility in the Windows control panel
- For Windows, Download a self-installer and run it.
- This will install the program, example files and a pdf manual.
- The manual, the publication describing the program and the example files will be in the folder \examples in the folder where the program is installed,
normally C:\Program Files (x86)\OrientXplot
- To use the example files, copy the \examples folder to a folder under \My documents
- After installing the program, read the manual for more information!
|
| |
![]()